What if Noise Could Be Seen?
Provided by the authors. CC License.
Unlike light, noise is not visible to the naked eye, but is perceived by the ears, transmitting the information to the brain for analysis. Humans are able to tell approximately whether a noise is coming from in front or behind them, from the left or the right, by detecting differences in sound intensity or delays between the sounds that reach the ears.
This ability to localize noise deteriorates in an industrial environment, because there are multiple sources of noise, and sound waves reflect off walls and machines, creating a complex acoustic field. In this situation, hearing is no longer effective in locating sources of noise. Acoustic experts need to know the position of noise sources to propose efficient reduction solutions.
To overcome this localization problem, a research project funded by the Institut de recherche Robert-Sauvé en santé et en sécurité du travail (IRSST), in collaboration with Université de Sherbrooke, has just begun at ÉTS, to develop an acoustic camera. The objective is to see noise in real time. Like a thermal camera that indicates temperature hot spots, the acoustic camera will display noise maps allowing the noise to be seen and thus to identify the sources positions.
Noisy Workplaces, a Major Issue!
In Quebec, the Commission des normes, de l’équité, de la santé et de la sécurité du travail accepted more than 74,000 claims of occupational hearing loss by workers between 1997 and 2016. Since 2010, this means there have been approximately 6,000 cases per year. What is more, the number of cases increased fivefold between 1997 and 2016. Between 287,000 and 359,000 workers are still exposed to harmful noise levels on a daily basis. Hearing loss is by far the most common occupational disease in Quebec and a major problem that requires the implementation of noise control measures.
Noise Control
In the workplace, three levels of control exist for healthy noise management:
- Level 1 – Eliminating or modifying the source of noise;
- Level 2 – Reducing noise as it is propagated through the use of acoustic materials or barriers;
- Level 3 – Protecting individuals with personal protective equipment (PPE).
Although PPE is the simplest and most widespread solution, and sometimes the only possible one, it still does not constitute optimal protection and should be proposed as a last resort. The first two levels of control are preferable—they are more efficient, but require knowledge of the position and amplitude of the noise source. This step in localization can be performed with an acoustic camera.
Seeing Noise with an Acoustic Camera
An acoustic camera is composed of a microphone array, an optical camera and a source localization algorithm. While the optical camera films the environment, the algorithm combines microphone signals to create an acoustic image. The two images, optical and acoustic, are then overlayed. The result is an image of the environment where hot spots, like a thermal camera, indicate the positions of the sources with the highest noise levels.
The microphones can be laid out on a plane surface or on a sphere. In the first case, the area in front of the plane of microphones is imaged acoustically; in the second spherical layout, it is the whole space around the camera. This is the latter solution that was selected to see noise in work environments. During this project, two microphone spheres will be studied. The first is an acoustically transparent hollow sphere, i.e. the acoustic waves have little or no interaction with the sphere (Figure 1.a). Conversely, the second sphere is completely rigid and, in this case, the acoustic waves are scattered by the sphere (Figure 1.b). The localization algorithm will be adapted to each type of sphere.
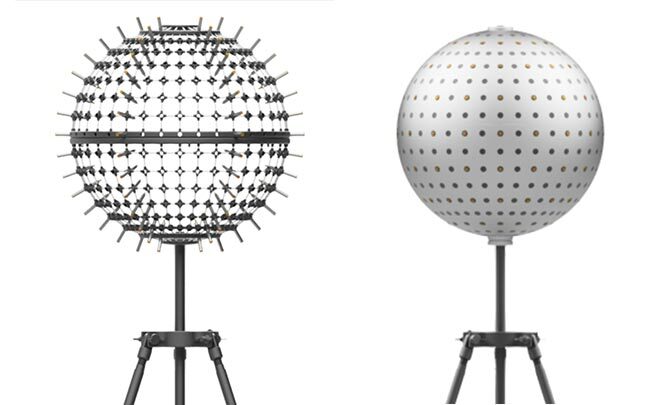
Figure 1: Spherical microphone arrays, a) hollow sphere with microphones emerging from the sphere and b) rigid sphere with microphones flush with the sphere.
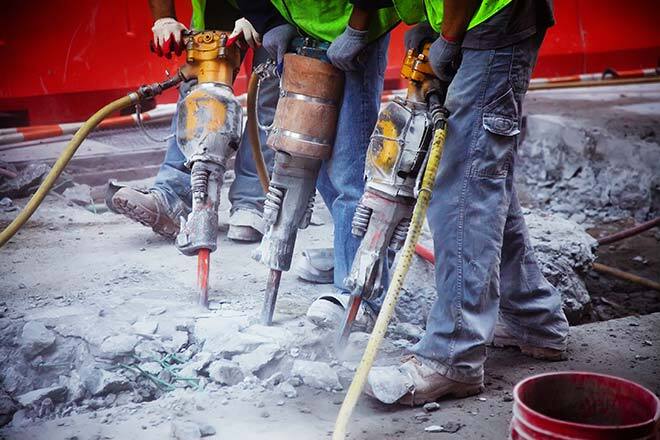
A preliminary study in a previous IRSST-funded project evaluated the performance of a source localization algorithm based on generalized cross-correlations with a hollow sphere [1]. Consider a noise source generating acoustic waves, for example, a hand drill held by an operator (Figure 2).
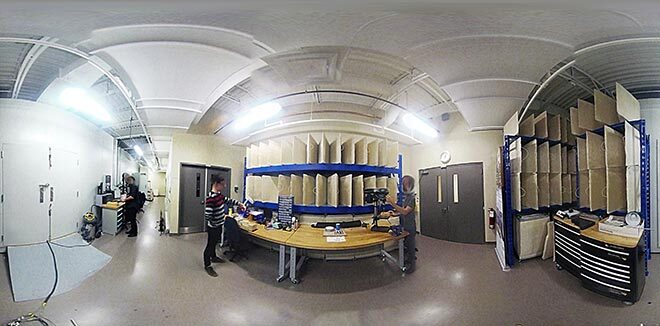
Figure 2: Photograph of a work environment where an operator is holding a drill.
Acoustic waves originating from noise sources or reflected on the walls spread toward the array and are picked up by the microphones at different times depending on their positions. The propagation delay between two microphones is estimated by cross-correlation of the signals and then projected onto the image, drawing a beam [2]. To obtain the final image, the delays between all pairs of microphones are projected onto the image where the beams intersect at the position of the source (Figure 3). In this case, it is impossible to identify the real source, as there are too many colour spots.
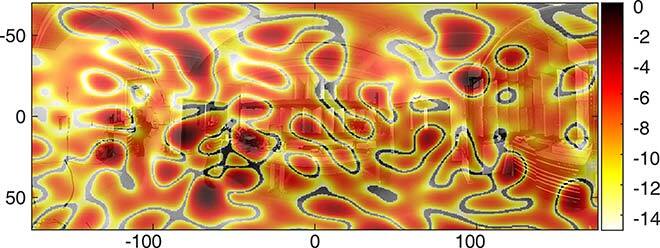
Figure 3: Acoustic image obtained with a standard technique. The dynamic range of the image spans from 0 to 15 dB.
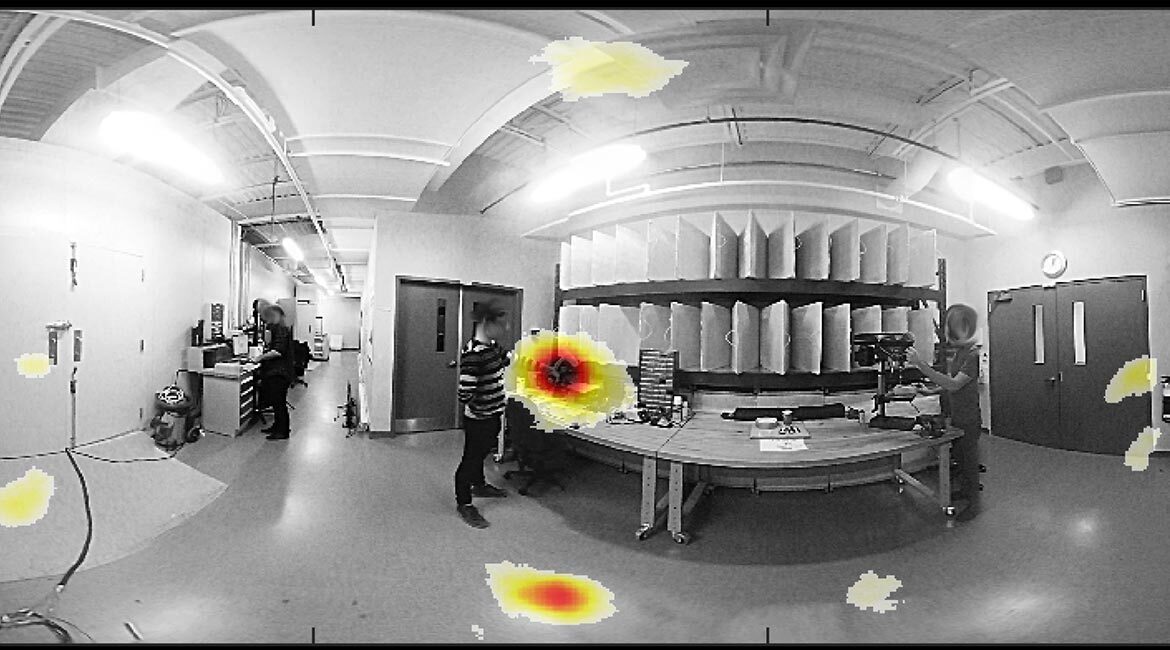
To increase image quality, the authors developed techniques that improve the estimation of delays and beam combinations leading to the result in Figure 4 [3–5]. Here, a large spot is found at the tip of the operator’s hand, where the drill is located. Secondary spots of lower amplitudes are visible and correspond to various acoustic reflections on the floor, walls, and ceiling. Thanks to the acoustic camera, it is possible to see the noise and to proceed in the application of control levels 1 and 2, i.e. taking appropriate steps for the source of noise and/or installing adequately sized acoustic materials and screens at the most relevant locations.
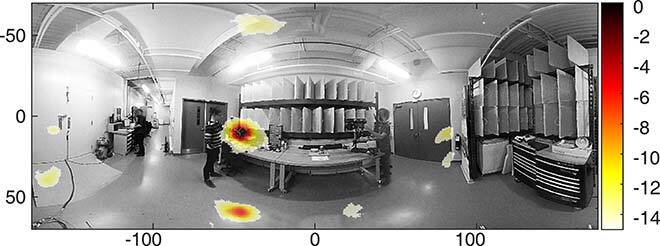
Figure 4: Acoustic image obtained with a technique developed by the authors. The dynamic range of the image spans from 0 to 15 dB.
Project Outlook
During this project, the performance of a range of algorithms associated with hollow and rigid arrays will be evaluated to determine which combination is best for work environments. In addition, embedded electronics making microphone signal acquisition possible and a source localization algorithm executed in real time will be developed in partnership with Université de Sherbrooke. Eventually, the acoustic camera will be controlled from a tablet equipped with a graphic interface to view the noise. This measuring instrument will be useful for acoustic experts in locating noise sources accurately and proposing effective noise control solutions to mitigate professional hearing loss.